
Many small business sales teams have a wealth of data stored in their sales software. Teams with access to CRM reporting tools can turn that data into useful reports that provide genuine insight and improve decision-making.
CRM reporting is the use of customer relationship management (CRM) software to monitor, evaluate, and visualize sales activities and outcomes. Advanced systems with a broader toolset also let you generate marketing and engagement reports.
A good sales report could provide anything from a clear overview of where the business’s revenue comes from to individual sales rep performance metrics. The key to an effective report is knowing which data to use and how to structure it.
In this guide, Nutshell details how small business sales teams can get the most from their CRM reporting tools, including which metrics to track and how to build a reporting dashboard your team will regularly use.
The primary reasons for poor sales dashboard performance are usually metric selection and workflow disconnection.
When sales teams select the wrong metrics to track, their dashboards aren’t as useful as they could be. You’ll often find teams defaulting to tracking activity volume metrics, such as the number of calls logged, emails sent, contacts added, etc. They’re easy to capture, and totals always increase, so they make you feel like you’re progressing.
The real problem with tracking activity metrics is that you’re measuring effort instead of outcomes. Metrics that help you track outcomes can tell you whether or not you’re going to hit your monthly goals.
Reports that don’t align with your workflows may not be included in recurring meetings or considered in decision-making because the data isn’t directly connected. A dashboard populated with misaligned data becomes more of a decoration than a useful tool.
When selecting metrics for your sales reporting dashboard, ask this question as an easy test: If the number drops by 20% tomorrow, will my team react and adjust? If it’s a yes, keep that data where you can see it.
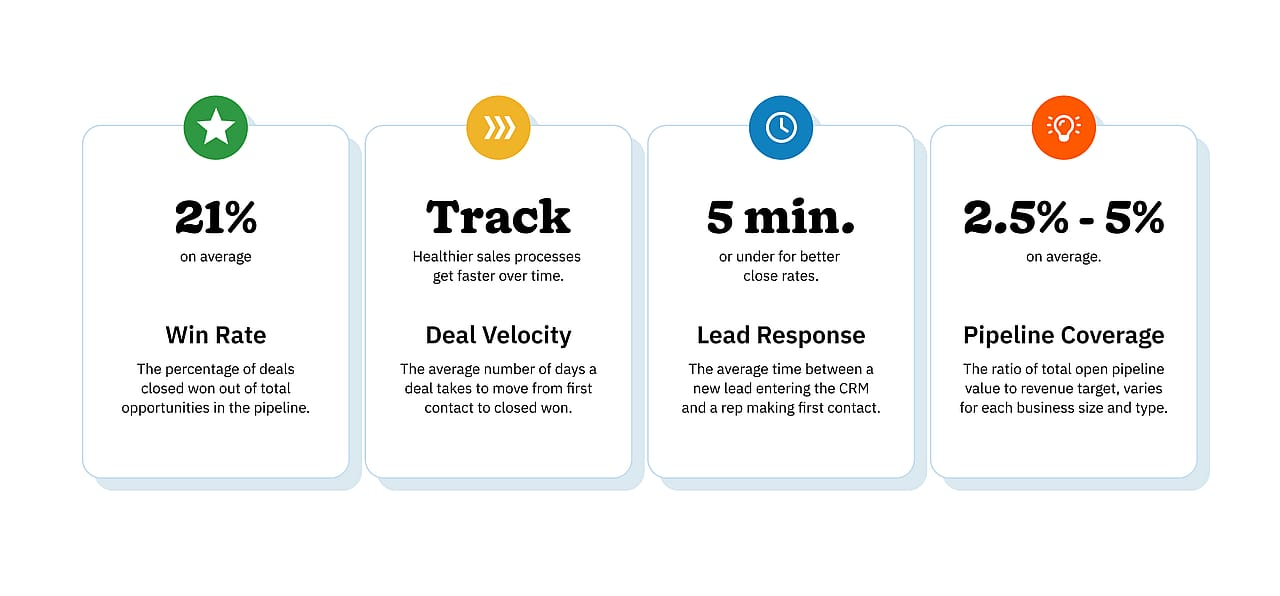
Four KPIs give sales teams a consistent view of their pipeline health:
Consistent dashboard usage is all about instilling the habit using these three tactics:
AI-powered reporting is fast becoming a standard across modern CRM platforms and comes in two distinct forms.
Built-in AI reporting
Some modern CRMs can provide detailed reports from your data by prompting the system in plain language. For instance, say you wanted a report illustrating the number and value of sales for each team member over the quarter. In this case, you could simply ask, “Show me sales by rep this quarter,” and receive your answer in chart form in seconds.
Sales teams can also use AI tools in platforms like these to surface specific insights about their data, including anomalies, pipeline gaps, and stalled deals. These capabilities put useful, actionable data in the hands of each rep.
AI and MCP integration reporting
Another way CRMs allow you to extract insights through AI is via MCP (Model Context Protocol) integration. MCP integration, in this context, is the ability to connect an AI platform, such as Claude and ChatGPT, directly to your CRM and use that platform for conversational data lookups, multistep workflow automation, and sales guidance.
On the reporting side, sales teams can use the MCP integration to quickly surface a broad range of useful data points, like deal queries, cross-object analysis, churn risk, competitive tracking, and more.
CRM reporting is at its most effective when you’ve pared the data points down to just the most meaningful KPIs that actually influence core decisions and review them regularly. Four of the most useful metrics for small businesses to track are win rate, pipeline coverage, lead response time, and deal velocity because they give teams optimal pipeline clarity.
AI reporting tools are making it even easier for teams to leverage and understand their data. That said, teams getting the most from their CRM data are those that have created a regular habit around their reporting and ensured that the metrics drive the decisions they make.
This story was produced by Nutshell and reviewed and distributed by Stacker.



